A closer look at Cross-channel Budgeting in Google Analytics

Foreword
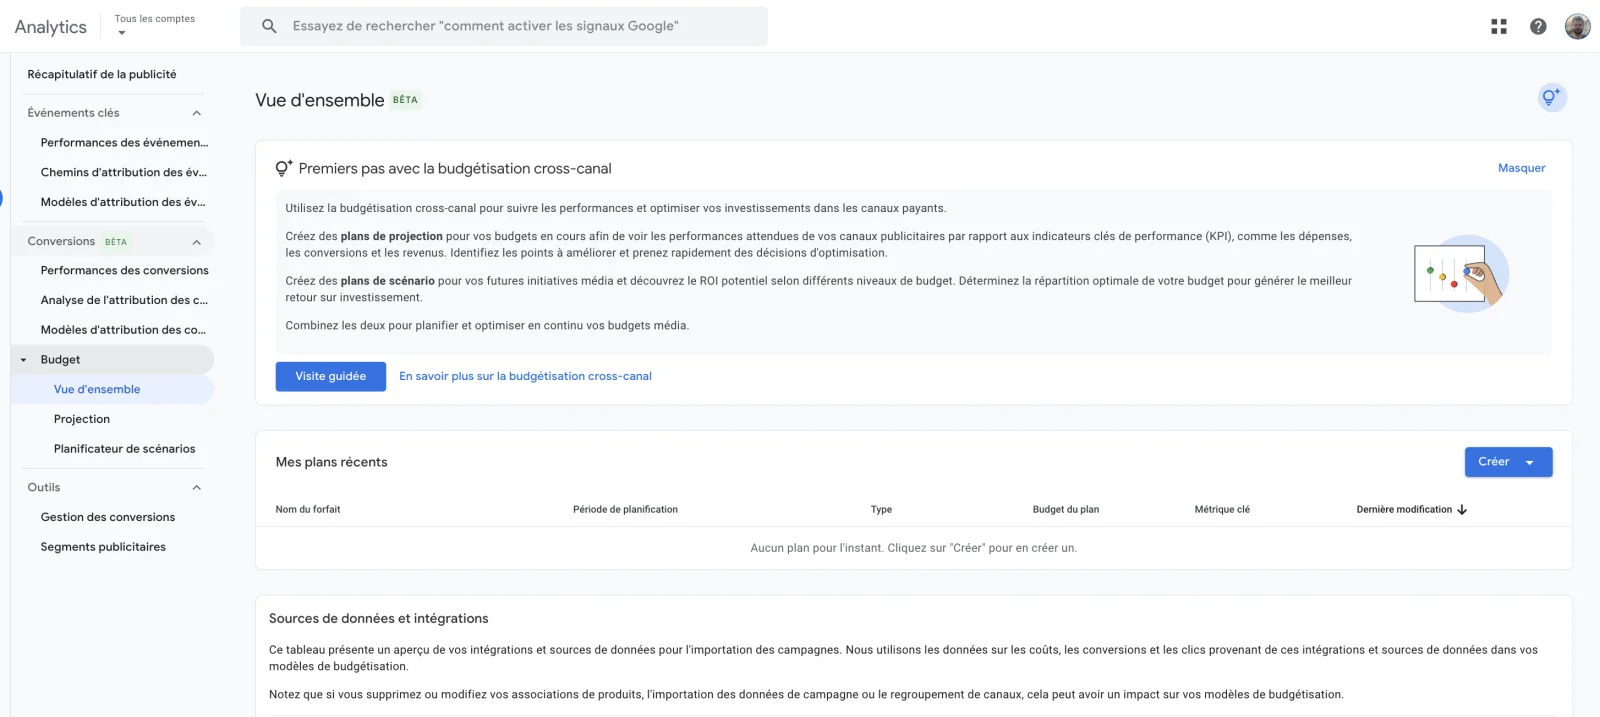
Google Analytics has rolled out a new feature accessible under Advertising > Cross-channel budgeting. It bundles two complementary modules: a Projection plan to track the pacing of an ongoing budget, and a Scenario Planner to simulate future allocations. The feature is in beta and not yet available on every property at the time of writing (May 2026).
What Google announces: let advertisers plan their media budget and project results based on different trade-offs between channels. Official documentation: Cross-channel budgeting plans (Beta).
The feature in brief
The section bundles two modules:
- A Projection plan that tracks the pacing of an ongoing budget (spend rate, expected conversions and revenue, projected ROAS).
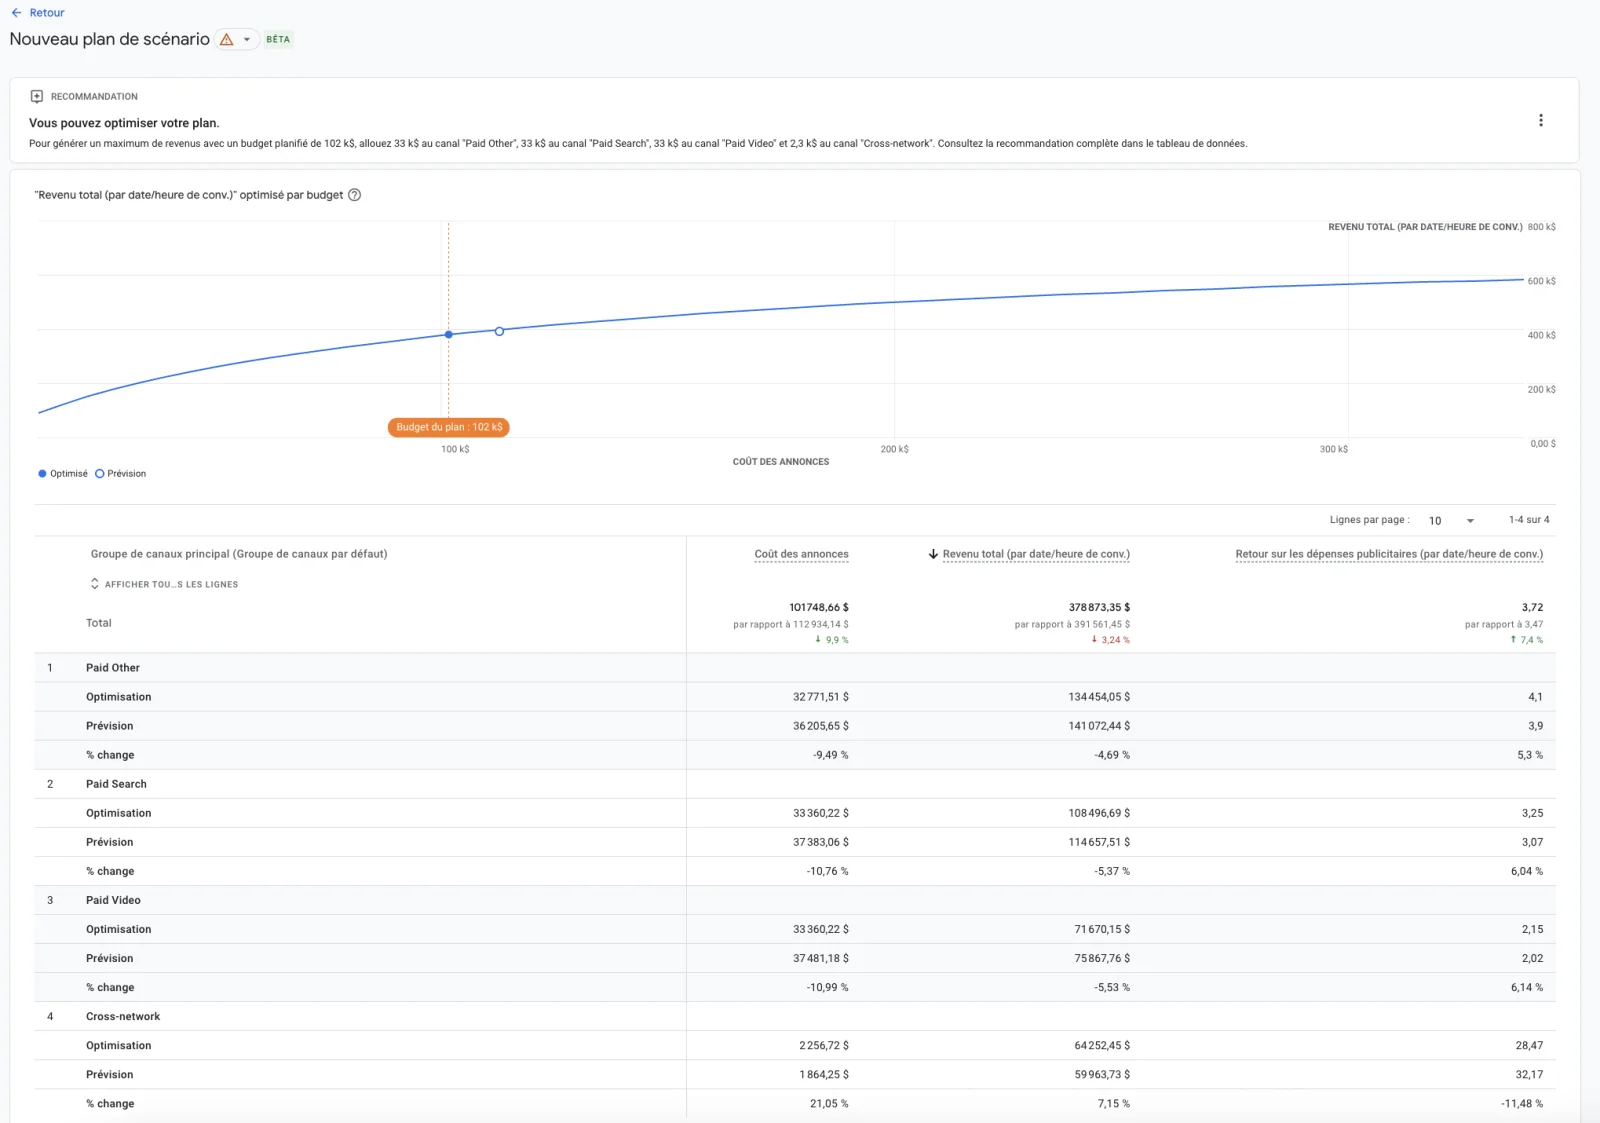
- A Scenario Planner that simulates several upcoming budget allocations and compares the projections of each scenario (conversions, revenue, ROAS), with response curves per channel.
Prerequisites
For this to work, Google Analytics needs visibility on the cost of every paid channel. For Google campaigns, the Google Ads link is enough, costs flow in automatically. For non-Google platforms (Meta, TikTok, Pinterest, Snap, Reddit), you have to import spend and impressions.
Imports happen under Admin > Data import. Three options:
- The native connector in Google Analytics, in beta for Meta, TikTok, Pinterest, Snap and Reddit (released in October 2025). A 24-month historical backfill is announced according to several third-party sources, to be checked on the actual property.
- The BigQuery import, useful when spend is already consolidated in a dataset.
- The CSV upload.
Official import documentation: Import cost data into Google Analytics.
How it works
Google Analytics uses your property's historical data (12 months minimum on paid channels) and runs a Bayesian regression to learn how variations in spend per channel drive variations in conversions and revenue. From that learning, the model projects what would happen with a different budget mix.
The model is inspired by Meridian, Google's open-source MMM. It differs on one central point: it is primarily fed by the Data-Driven Attribution (DDA) of the property. The DDA acts as a Bayesian prior on the regression. A strict MMM (Meridian-style) folds in external variables (seasonality, macro), adstock, geo-level data and causal calibration via incrementality tests, building blocks that are missing here.
The EdgeAngel take
As of this note (May 2026), we don't yet have an EdgeAngel client case study against which to empirically test the model's outputs. The analysis below is based on Google's documentation and our own methodological reading.
A shift in Google Analytics' positioning
Google Analytics now ships a budget planning layer in its interface, alongside its historical traffic analysis and attribution capabilities. The tool is expanding toward media steering.
A model that inherits the biases of Google Analytics attribution
The engine learns from the DDA. And the DDA, by design:
- Over-weights channels close to conversion (bottom of funnel, strong intent).
- Captures post-click better than post-view.
- Sees what the GA tag sees, meaning what travels through the browser after consent.
What this means for the simulation:
- Google intent-driven campaigns (Search, conversion-optimized Performance Max) are valued by the DDA, so they are favored in the simulation.
- Demand Gen and YouTube are also valued well, as long as the property receives Google Ads engaged-view signals, which allow post-view attribution in GA.
- On the flip side, upper-funnel channels and channels whose impressions and engagements don't natively flow into Google Analytics will see their contribution under-estimated by the model. This is the case for Meta: the CAPI serves Meta's platform-side reporting, it does not feed attribution inside Google Analytics.
Our core conviction on this topic: the Scenario Planner is useful for trade-offs across channels that Google Analytics measures correctly. It hits its limit the moment you try to compare a well-tracked channel with a channel that GA attribution under-weights by construction.
So, what should you do?
Turn the feature on. Activation is free, and importing the cost data of non-Google platforms is useful beyond the Scenario Planner itself (it enriches all GA reports). What matters is testing the projections with a level head on upper-funnel trade-offs.
For advertisers with significant media budgets, measurement-grade efficacy work calls for a real MMM. Published benchmarks converge on meaningful efficiency gains once budget reallocation is optimized:
- A banking-sector case study reports +20% in marketing efficiency and +15% in customer acquisition after MMM-driven budget reallocation [5].
- An omnichannel e-commerce case shows MMM reallocation delivering +32% in incremental revenue [6].
- On the Akulaku platform (Meridian case study), re-optimizing the budget at a constant total spend projects +16% in GMV [7].
- Several sources converge on the fact that a 5% efficiency gain on a €100K monthly budget is enough to pay for the MMM project [8]. At multi-million-euro budget scales, the leverage is mechanical.
Concretely, on a €10M annual media budget, an efficiency gain of 5 to 10% on reallocation translates into €500K to €1M per year. At that level of stakes, measurement isn't handed over to a Scenario Planner fed by GA attribution. It is built with a causal MMM (Meridian-style) and incrementality tests (Causal Impact, GeoLift) to calibrate the priors. That is the approach we deploy with our clients running serious media budgets.
To go deeper on these approaches, two EdgeAngel resources: our note on Causal Impact and Causmos and our Marketing Mix Modeling and Meridian offering.
Sources and references
- Cross-channel budgeting plans (Beta) — Google Analytics Help
- Import cost data into Google Analytics
- Meridian — Open-source MMM by Google
- About the Meridian project — Google for Developers
- Case study: Marketing Mix Modeling Impact on Banking Performance — Quantzig
- Ten real-life MMM examples — Measured
- Google Meridian Akulaku case study — Think with Google APAC
- Optimize Marketing Spend with MMM for ROI in 2025 — Bigeye
- EdgeAngel expert note — Causal Impact and Causmos
- EdgeAngel offering — Marketing Mix Modeling and Meridian
Wondering where this feature fits in your measurement stack?
If you want to pressure-test the place of Google Analytics' cross-channel budgeting in your media steering, or scope an MMM or geo-incrementality project on your highest-stake channels, we'd be glad to look at your case together.
More notes like this one?
We publish regularly on LinkedIn what we learn in the field. The algorithm doesn't favor us, so hit the bell to make sure nothing slips through.