Causmos & Causal Impact: Measuring Social Ads Campaign Effectiveness

Foreword
Precisely measuring the real impact of advertising campaigns remains a major challenge in 2025 for most players, whether advertisers or media agencies:
- The regulatory and technical framework is constantly evolving, which complicates performance tracking. This complexity is particularly marked for "Top of funnel" campaigns (e.g., Demand Gen campaigns on Google and more broadly Social Ads campaigns). Indeed, these campaigns often initiate longer and non-linear user journeys, where advertising interactions occur as much post-click as post-view. However, tracing these exposures and their real influence in a unified way across multiple platforms and devices is a puzzle, and no tool today allows consolidating and attributing with a good level of confidence the contribution of each touchpoint.
- Different advertising platforms and analytics tools provide performance data that don't match, leaving advertisers and agencies facing a dilemma: which data to believe and what decisions to make to optimize investments?
💡 Why is this a challenge?
- Knowing whether "top of funnel" campaigns actually generate business is fundamental. Without this, how can you define a media buying strategy that seeks growth, not just settling for what seems profitable?
- Because the risk of focusing exclusively on intent-based levers is hitting a glass ceiling and losing growth opportunities.
- This is where an incremental analysis/test approach (like Causal Impact) allows addressing this challenge in a scientific and robust manner.

Case Study: Causal Impact Analysis (with Causmos and GA4) to Assess Social Ads Performance
Study Scope: Questions and Context
Our client tripled their Social Ads budgets between 2024 and 2025 (over the first 4 months).
Two key questions:
- What is the real impact of this budget increase on their overall business results?
- Does GA4 underestimate indirect conversions generated by social campaigns (especially post-view)?
The analysis covers the period from January 1 to April 30, 2025.
Simplified Methodology: What is Causal Impact?
Causal Impact is based on a comparison between two groups (Test and Control):
- Learning phase: the model learns the performance correlation between groups before modifying the advertising setup.
- Analysis phase: after modification (budget increase in our case), the model predicts the theoretical performance without intervention on the test group. The gap between prediction and reality precisely measures the real incremental impact.
How to Define Test and Control Groups Effectively?
Rigorous group constitution is a determining step.
The Test Group: corresponds to the population that was affected by the modification being evaluated. In this client case, it was the geographic cities where the Social Ads budget increase was actually applied. For this client with a local presence via "centers", the Social Ads budget increase was activated only on part of these centers.
Control Groups: these groups are not supposed to be impacted by the studied event. Two groups were constituted for this analysis.
- Control Group 1: composed of cities with centers that did not activate the Social Ads setup or did not benefit from the budget increase.
- Control Group 2: based on SEO performance excluding the homepage, considered less directly impacted by brand awareness and therefore more independent of Social Ads budget variations.
⚠️ Keep in Mind
If it's not possible to opportunistically identify distinct test and control groups, it becomes necessary to plan and design the test in advance. This may involve launching campaigns on a specific population for the test, or conversely, suspending them on another. It's also possible to use "conversion lift" features offered by certain platforms if they are accessible (Google and Meta) - you'll have less control over test design.
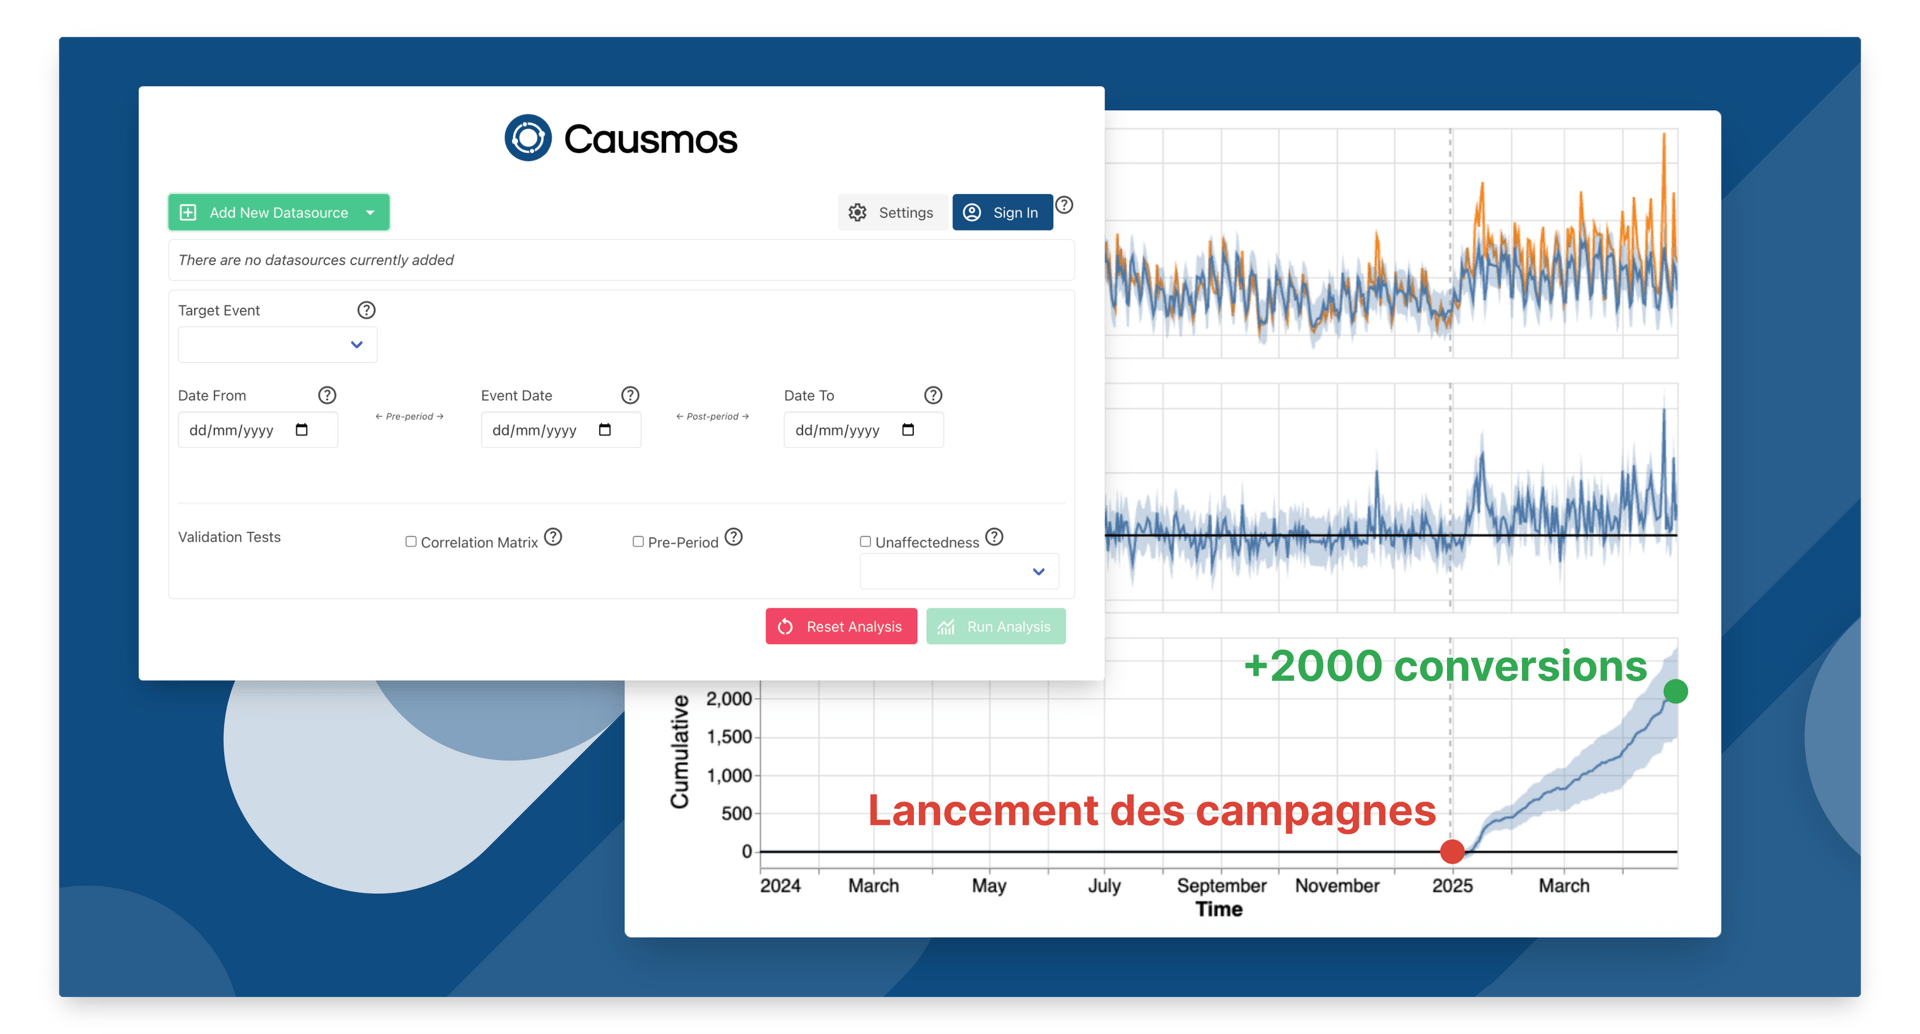
Analysis and Results Obtained with Causmos
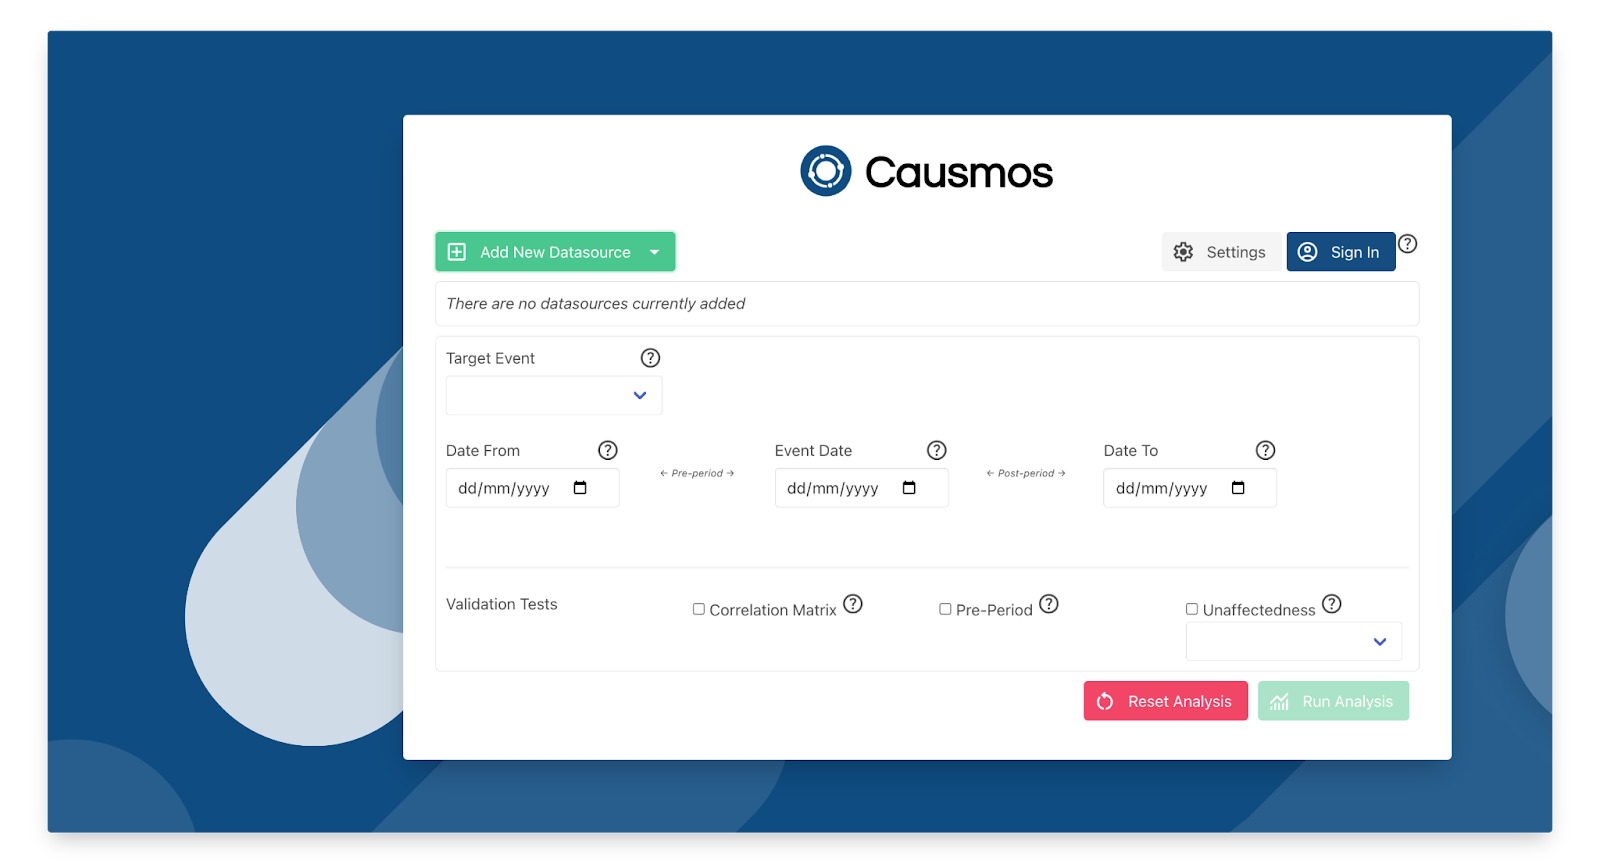
The Causal Impact analysis was then conducted using Causmos (open-source web app initiated by Google).
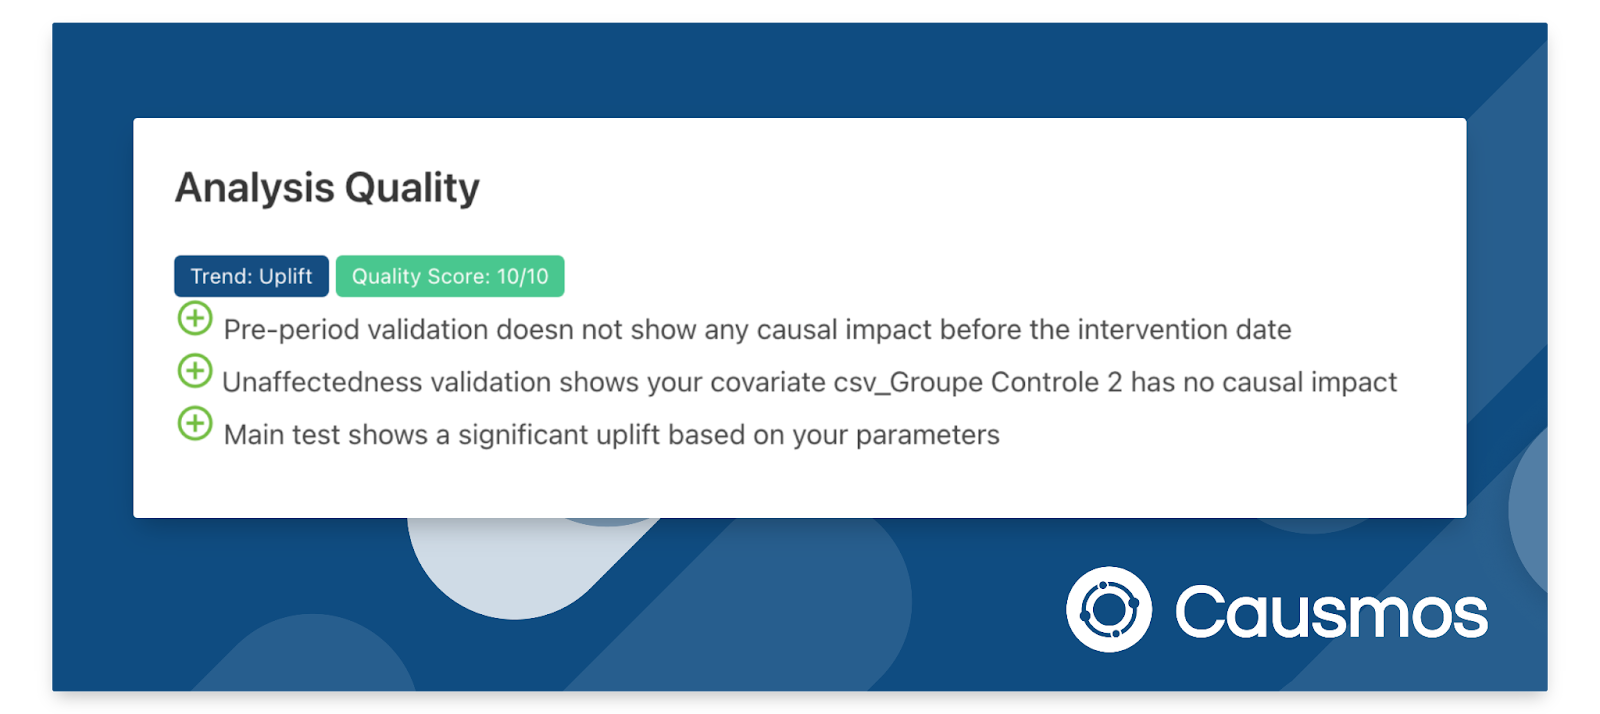
Test Validation ✅
The tool provides an assessment of analysis quality. In this case, the quality score was 10/10, and the following points were confirmed:
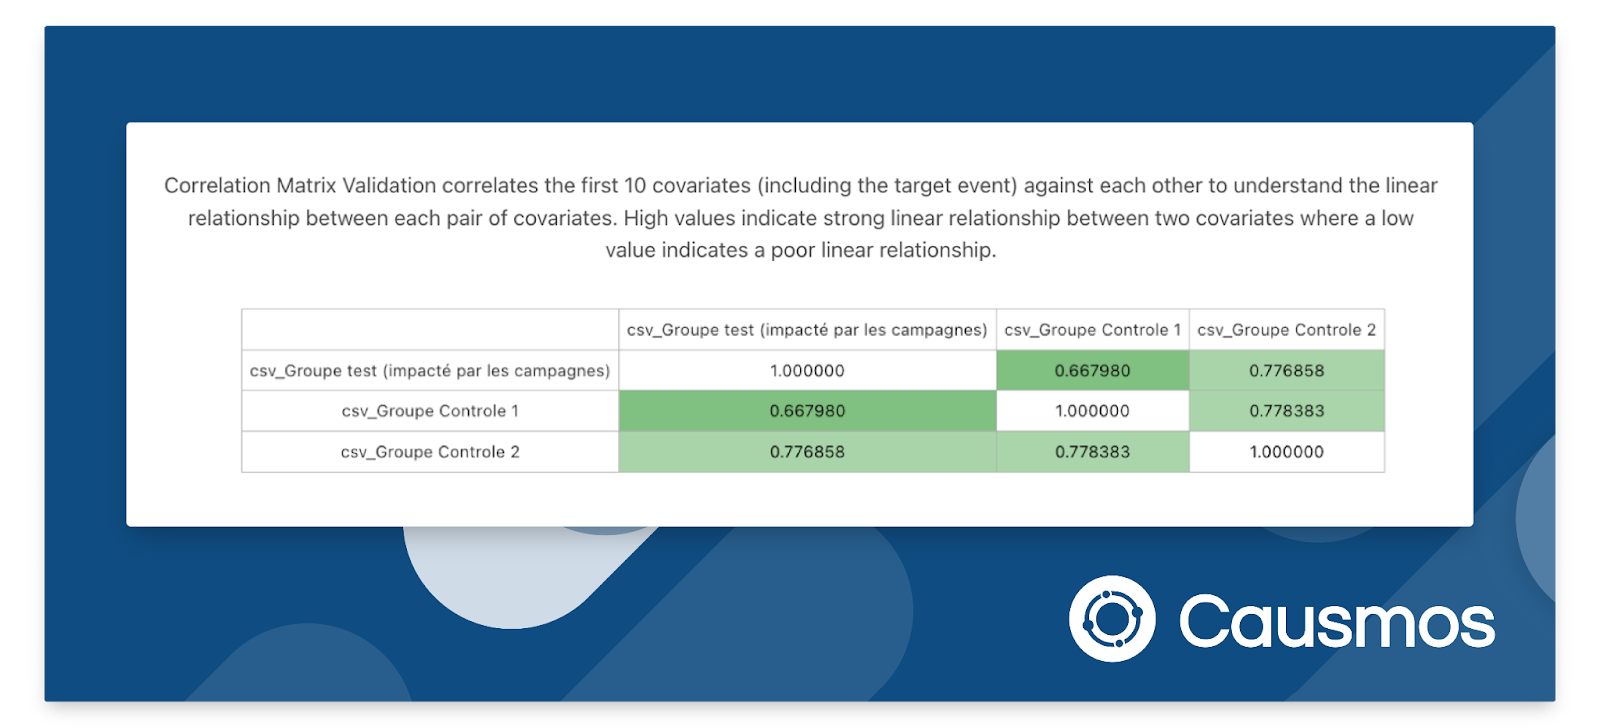
Group Correlation ✅
The correlation matrix validates the linear relationship between covariates (including the target event). High values indicate a strong linear relationship. It's recommended to aim for a correlation close to 0.7 or more between groups before intervention.
Test Result 🚀
The model uses the equation defined during the learning phase to predict what would have happened to the test group after the event, in the absence of intervention. It applies this equation to the control group over the post-event period to establish this prediction. Finally, the model compares this prediction to observed reality to quantify the increment:
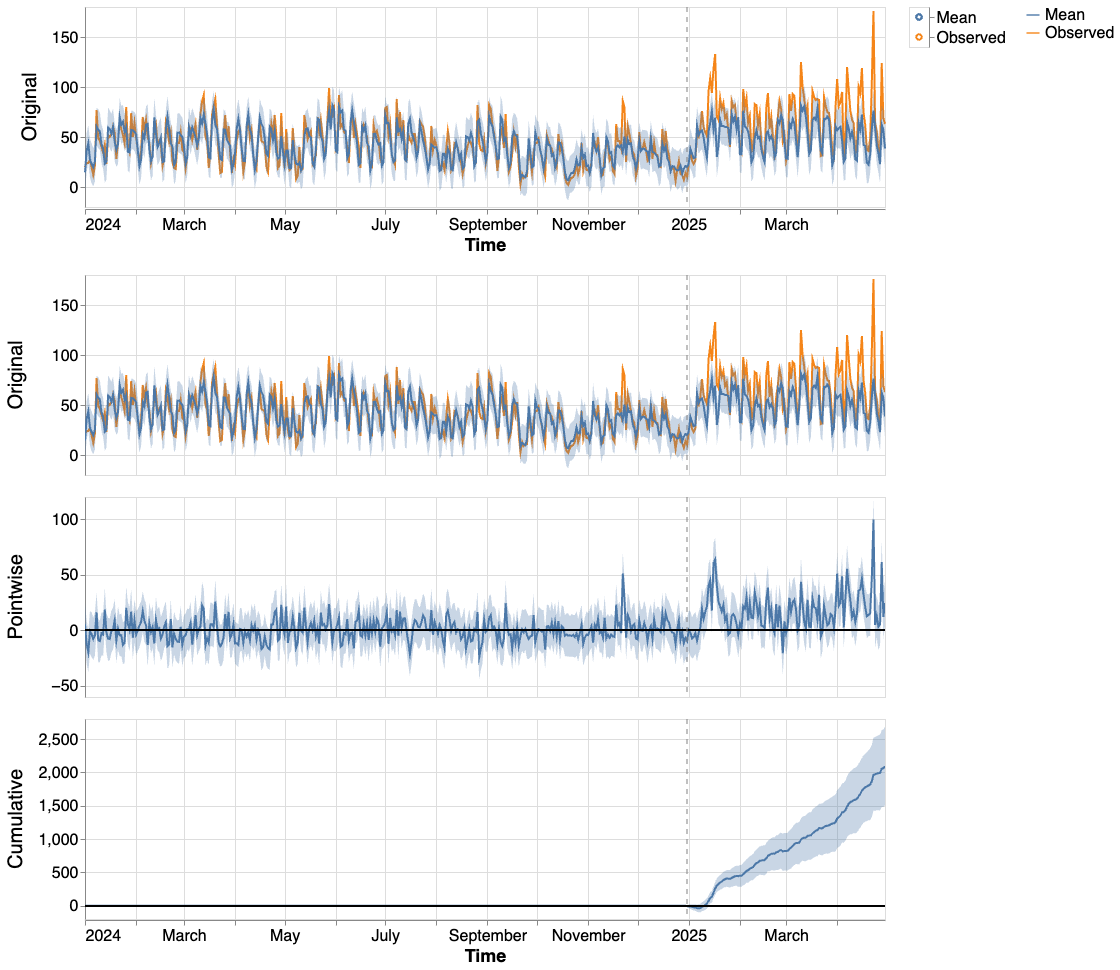
In this study, the analysis revealed that the Social Ads budget increase generated an increment of 2070 conversions over the considered period.
Conclusions and Result Extrapolations
These 2070 conversions are therefore attributable to the Social Ads budget increase. In comparison, direct attribution to Social Ads in GA4 indicated an increment of only 367 conversions on this Test Group.
Extrapolation and Learning #1
- Each Social Ads conversion tracked in GA4 actually corresponds to 5.7 incremental conversions (2070/367).
- This ratio quantifies the indirect contribution of Social Ads; the model detects a larger contribution than what platforms (ad networks) are able to detect on their side (x2.5).
Extrapolation and Learning #2
- While the initial reading via GA4 attribution suggested that Social Ads represented less than 6% of conversions, applying the Causal Impact analysis results indicates that its real contribution would be around 32%.
Extrapolation and Learning #3
- Consequently, the Social Ads cost per conversion is mechanically divided by 5.7. In our client case, the CPL dropped below €10, positioning this lever as more profitable than intent-based levers (SEA - Acquisition).
This analysis methodology was applied to several brands in the group and conclusions were similar. This was able to constitute a decision lever to adapt the media mix and prepare the acceleration of investments on top-of-funnel levers (Social Ads / DemandGen on GAds) for the coming months.
Perspectives on Advertising Effectiveness Measurement in 2025
To address the challenge of advertising effectiveness measurement, we recommend following these steps:
Step 1 (prerequisite): implement top-notch tracking (GTM server-side, advanced conversion tracking, and first-party data exploitation)
This allows high-performance management of bottom-of-funnel campaigns (SEA, Shopping) and provides initial performance signals for other campaign types (PMax, Demand Gen, Social Ads, etc.).
 Tracking Setup
For support in implementing these essential elements, our team is available to discuss your needs: contact us
Step 2: combine analytics data and ad platform data in your reports.
This offers two complementary readings of performance. Ad platforms provide broader contribution data and a vision closer to incremental performance. Activating advanced conversion tracking (Enhanced Conversions, Advanced Matching) will also help platforms improve their vision of contribution and conversions (especially for post-view contribution).
Dashboard Setup
On this topic, we developed Capture Marketing Performance which precisely addresses this challenge (learn more) and can help you quickly deploy this type of dashboard: contact us
Step 3: integrate incremental analyses and tests into your management.
As illustrated by the presented case, analysis (via Causal Impact or other approaches like TBR + MM) becomes a key element to justify and optimize investments in top-of-funnel campaigns. These analyses can apply to various issues such as:
- Evaluate the real profitability of top-of-funnel campaigns to scale investments and performance (cf. this article's use case) or cut unprofitable investments.
- Measure campaign impact for brands with a strong physical presence (here by defining a robust geo-based test protocol).
- Analyze the relevance of buying brand keywords in SEA/Shopping, especially in a competitive context with resellers on their own products.
- Etc.
Incremental Testing Implementation
If you're interested in implementing incremental tests, whether you're an advertiser or media agency, we offer support to advance on these challenges. Don't hesitate to contact us to discuss your projects.
Step 4 (For more advanced organizations): deploy an MMM solution
Implementing an MMM (e.g., Google's Meridian) is the final step that allows attributing performance by lever while considering a wide range of parameters and enabling media budget management from a macro perspective considering the lever's true impact on business incrementality.
These projects are generally complex and costly to implement and maintain, and are therefore more suited to large organizations for now (but it will certainly be more affordable in the coming months/years with the current dynamics in the adTech/marTech market).
Marketing Mix Modeling with Google Meridian
We deploy Google Meridian to make MMM accessible and operational. Discover our MMM services →
More notes like this one?
We publish regularly on LinkedIn what we learn in the field. The algorithm doesn't favor us, so hit the bell to make sure nothing slips through.