CRO Analysis with Piano Analytics & Microsoft Clarity

Introduction: What is CRO?
CRO, for Conversion Rate Optimization, refers to all methods aimed at improving conversion rates on a website or application. This can involve increasing the number of quote requests, newsletter sign-ups, downloads, or sales, depending on the journey's objectives.
Optimizing a conversion rate isn't just about "doing better": it's about understanding where, why, and how users leave a journey before reaching the goal. This approach is based on a structured analytical process, combining:
- the measurement of user behavior, through navigation data,
- the analysis of friction points, visible in journeys or content,
- and the identification of concrete levers for improvement, to be tested or corrected.
In this article, we propose a complete method for conducting a CRO analysis from a multi-step lead generation funnel. Objective: to show how to move from a simple observation of "conversion drop" to an in-depth analysis, combining quantitative and qualitative data, and above all, leading to concrete optimization recommendations.


💡 Why does it matter?
- Improving conversion rates constitutes a direct performance lever for digital assets. In a context where acquisition costs are rising and user journeys are becoming more complex, optimizing existing assets becomes a priority.
- Precisely identifying the steps in a funnel that generate loss allows optimization efforts to be targeted. Otherwise, adjustment decisions are based on hunches or partial signals, risking diverting resources from the real blocking points.
- The implementation of a well-equipped CRO approach addresses this issue: it allows for objectifying friction zones, cross-referencing behavioral and contextual data, and isolating high-impact improvement levers.
Use Case: Analysis of a Multi-Step Quote Request Form with Piano Analytics and Microsoft Clarity Tools
Analysis Scope: Perimeter, Funnel, and Hypotheses
The study focuses on a typical "quote request" conversion journey accessible from a B2B website. This form is structured into four successive steps plus the final step: confirmation of the request.
An advanced tagging plan has been implemented on this journey. It allows for identifying the display of each step, the final validation of the form, and retrieving the variables indicated by the user.
All data is collected via a structured data layer, then sent to Piano Analytics, which allows for a complete reading of the funnel and a segmented behavioral analysis.
The objective of the study is twofold:
- Measure the performance of each step (pass-through rate, abandonment),
-
Identify priority optimization levers, through a series of
structuring questions:
- What are the conversion rates per step?
- Where are the main breaking points?
- Can we isolate profiles or segments more affected by these abandonments?
- Do these behaviors reveal a UX friction or an offer/need mismatch?
Funnel Analysis in Piano Analytics
Piano Analytics allows for analyzing a conversion journey via several approaches: event exploration report with filters, cross-segmentation on metrics in data query reports, or custom visualizations via boards.
In this case, we favored the use of the native "Funnel" feature, which offers a direct and consolidated view of pass-through rates between steps.
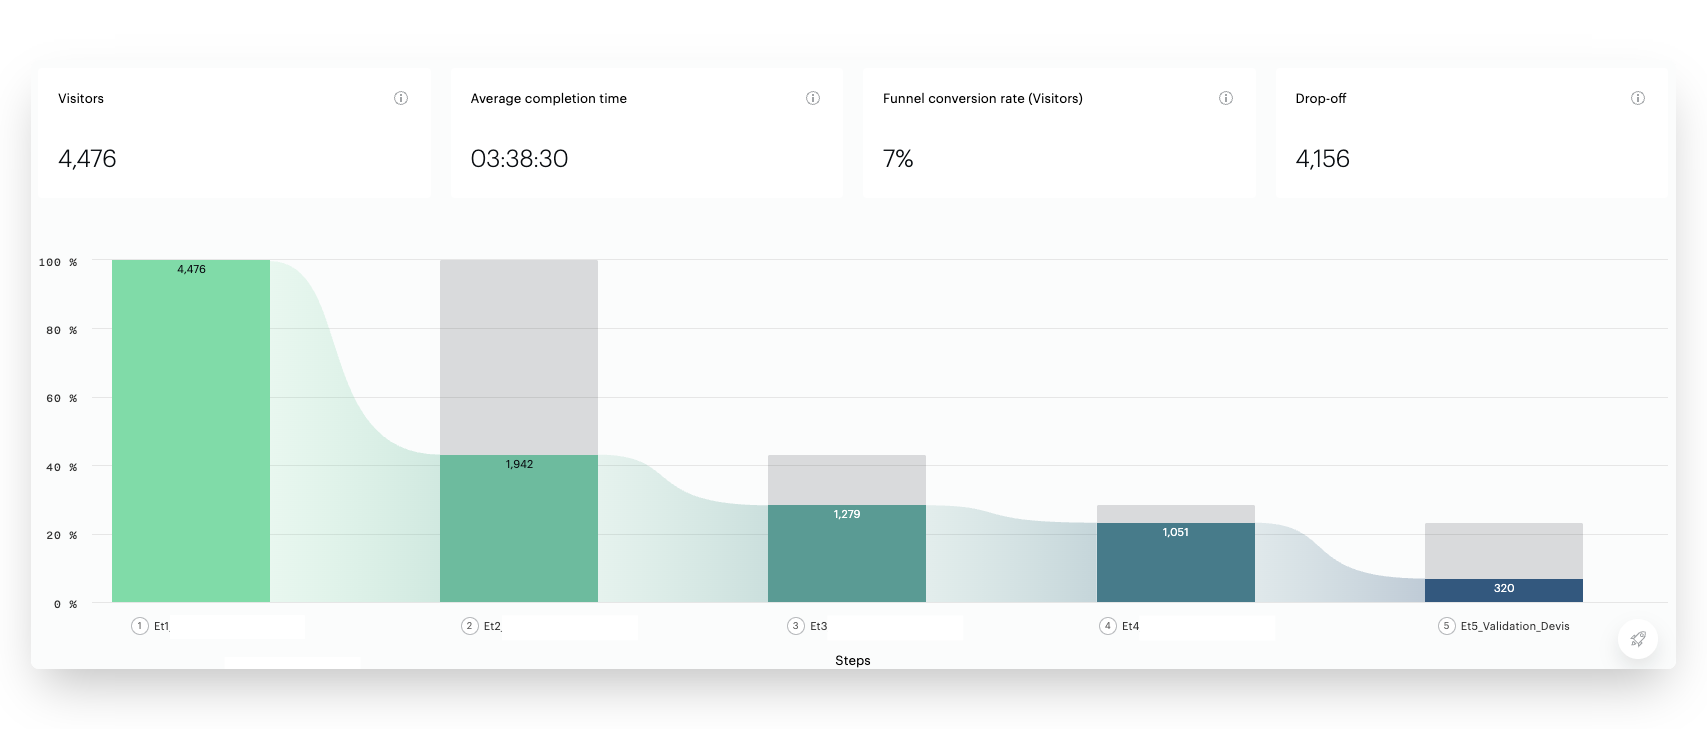
The funnel was built from the display events reported at each screen of the form. This configuration allows for precisely tracking user progress, step by step.
The initial results highlight significant breaks in the journey:
- 57% of users leave the journey between step 1 and step 2,
- An additional 34% abandon between step 2 and step 3,
- 18% leave the funnel between step 3 and step 4
- The most significant drop occurs at the end: 70% of users who reach step 4 do not finalize the request.
Identifying Friction Points
⚠️ Critical reading
Before drawing hasty conclusions, it is essential to recontextualize these losses in light of the funnel's content.
Certain breaks are frequent — even expected — in this type of journey:
- Step 1 often acts as an unfiltered entry point, likely to capture unqualified or simply curious users,
- Steps containing expected information (like an indicative price) can trigger abandonment once this information has been obtained,
- Finally, entering personal details historically remains the most sensitive step, mechanically generating a high exit rate.
These elements must be taken into account to establish robust hypotheses and target the steps that warrant in-depth investigation.
In light of these observations, attention is focused on the loss observed in step 2 and step 3, where 34% of users leave the journey. The user has expressed a clear intention but does not proceed to the next steps.
- Mismatch between user needs and step content: the displayed options do not match expectations or needs.
- Technical problems related to certain browsing environments: display bugs on mobile, incompatibilities with certain OS or browsers, non-interactive elements.
- Invisible UX frictions: slow loading, confusing visual hierarchy, too many options, or apparent lack of results.
- Unsatisfied expectation: the user expected to obtain immediate information (price, conditions, delay) that is not presented at this stage.
- Perceived lack of personalization: the suggestions of needs seem generic or poorly adapted, which can generate rapid disengagement.
- Dissonance effect: the user realizes, at this stage, that the offer does not meet their initial need (conflict between expressed need and available products).
- Perceived repetition or redundancy in the fields or questions asked, which can generate a feeling of heaviness or an unnecessary step.
The segmented analysis that follows aims to test some of these hypotheses by isolating the users concerned, then qualifying them through behavioral observation.
Creating and Analyzing a Targeted Segment
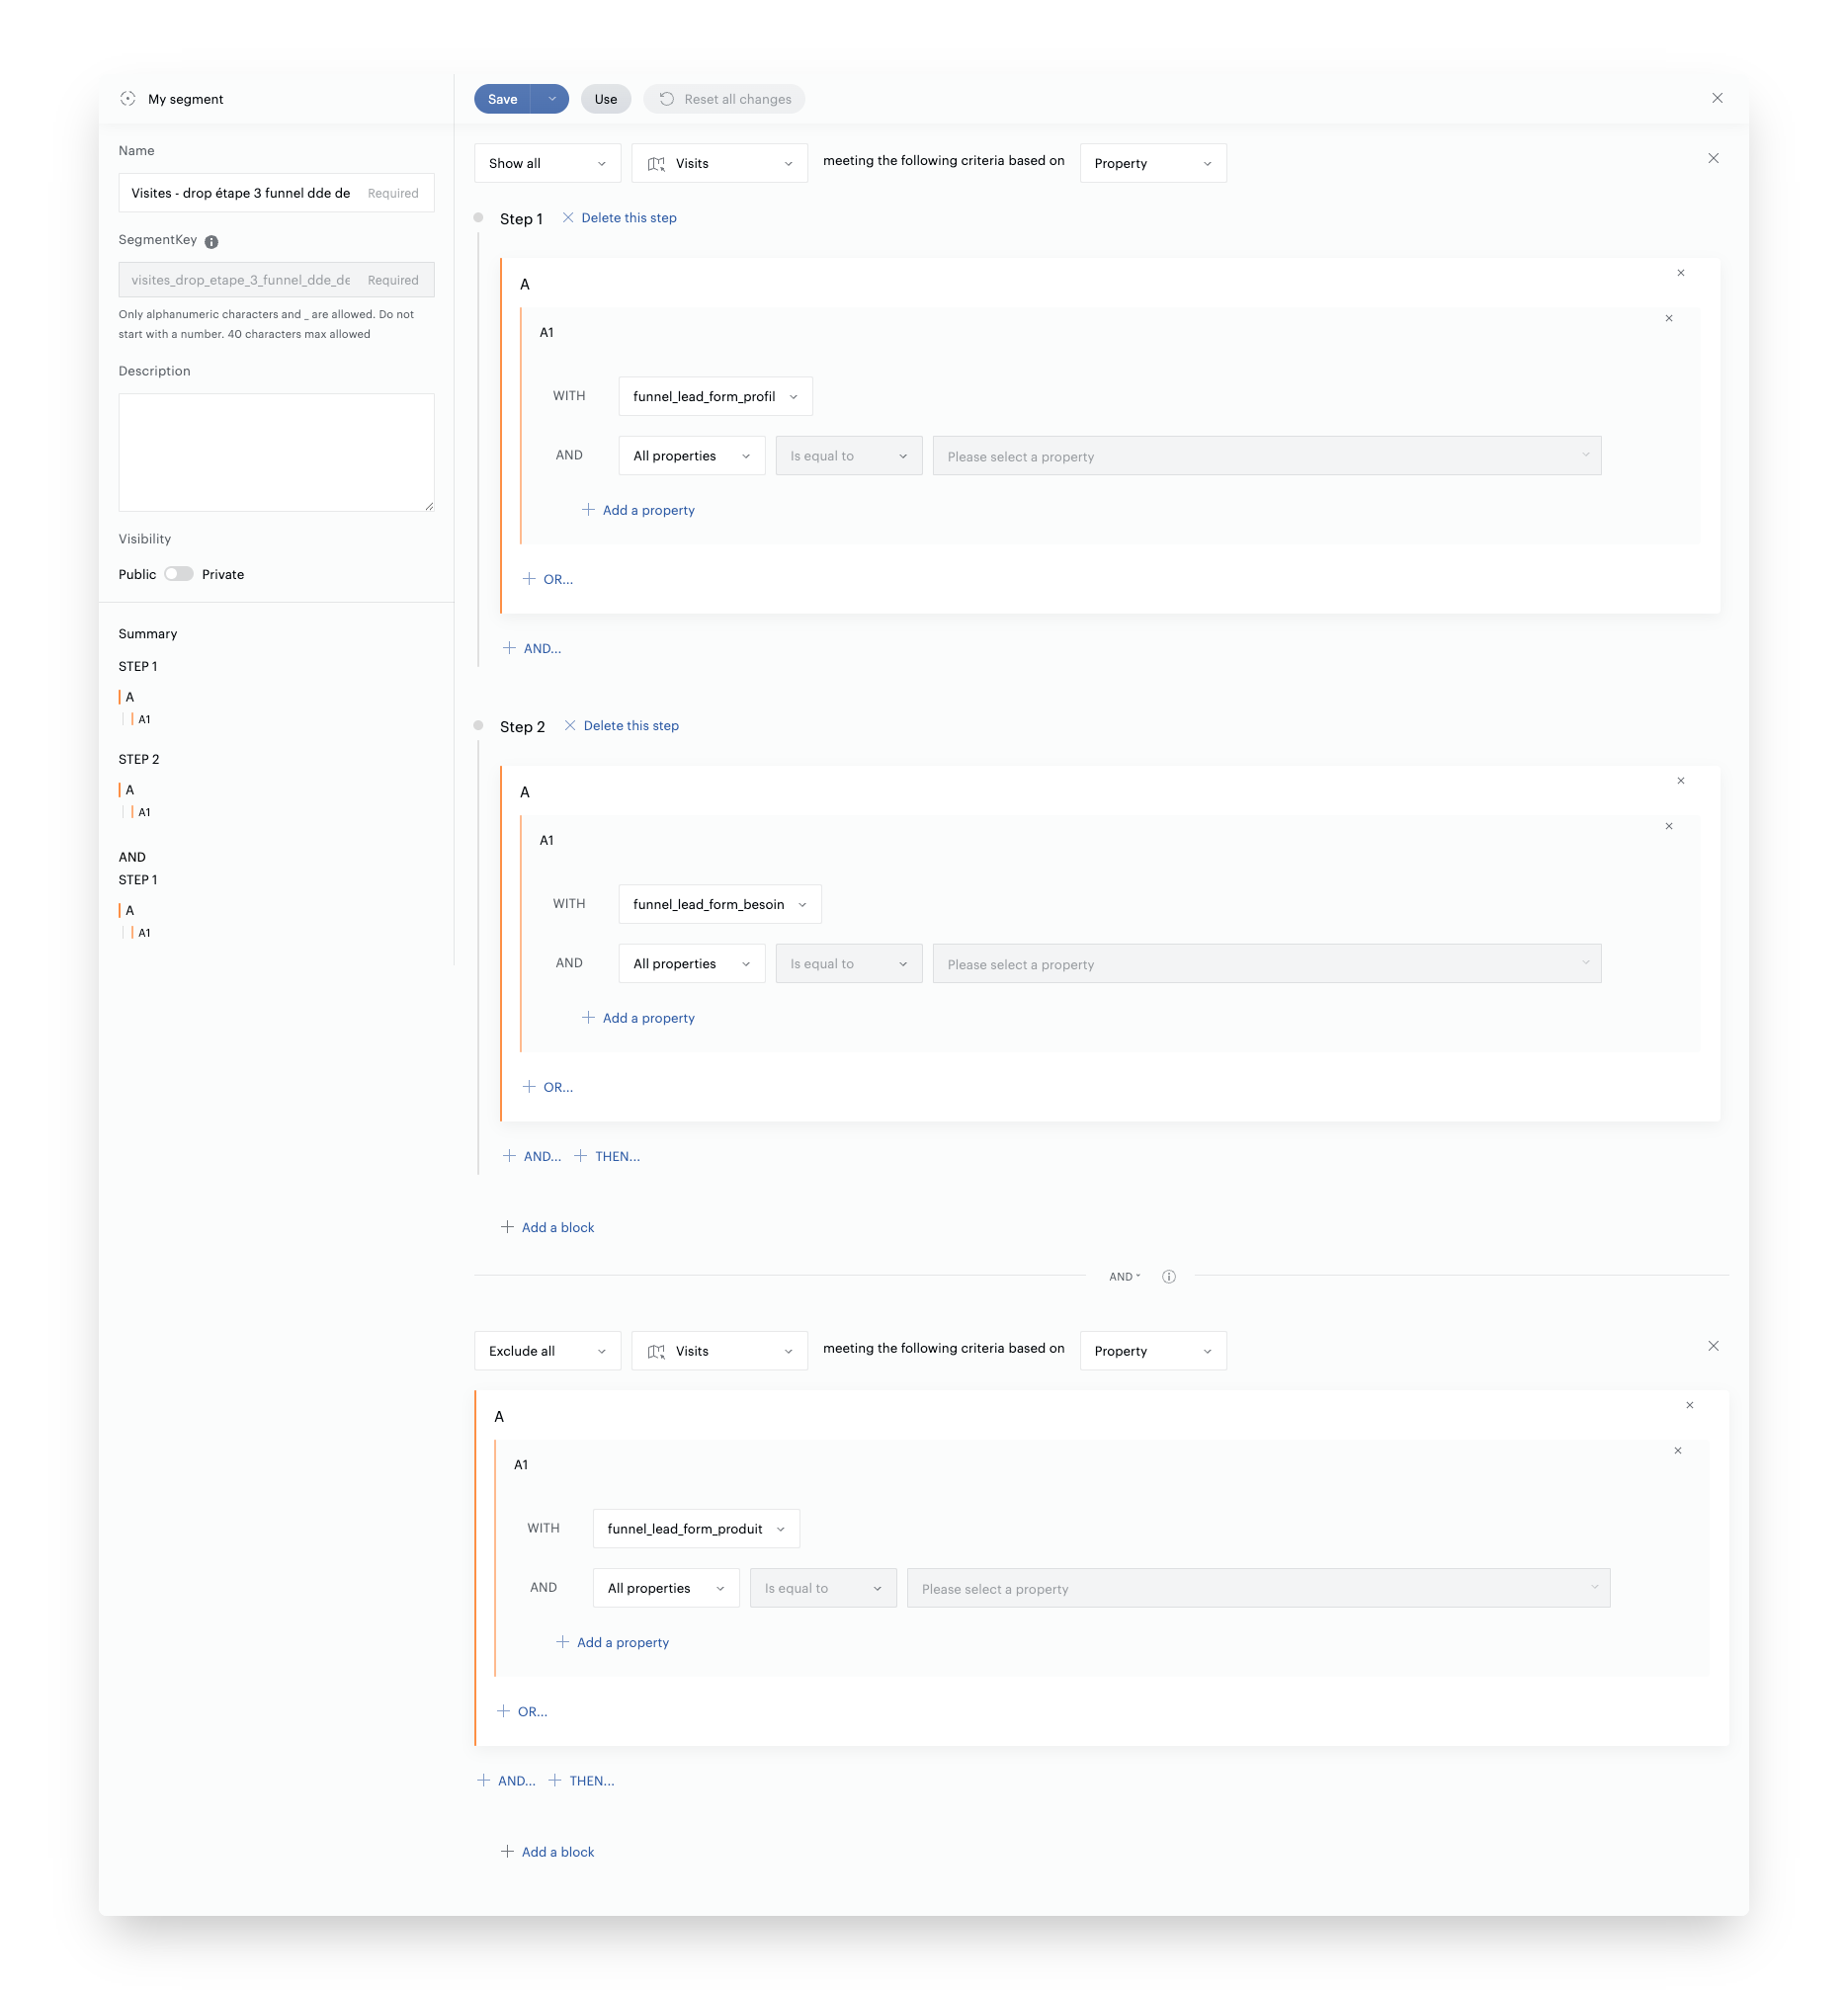
To more finely qualify the break identified between step 2 and step 3, a targeted segment was built in Piano Analytics. It is based on the following definition:
- Inclusion: visits that triggered the display event for step 1 then step 2
- Exclusion: visits that continued to the display of step 3
This segment allows for isolating users who leave the journey after expressing a need, without consulting the products. It forms the basis for a more qualitative and contextual analysis.
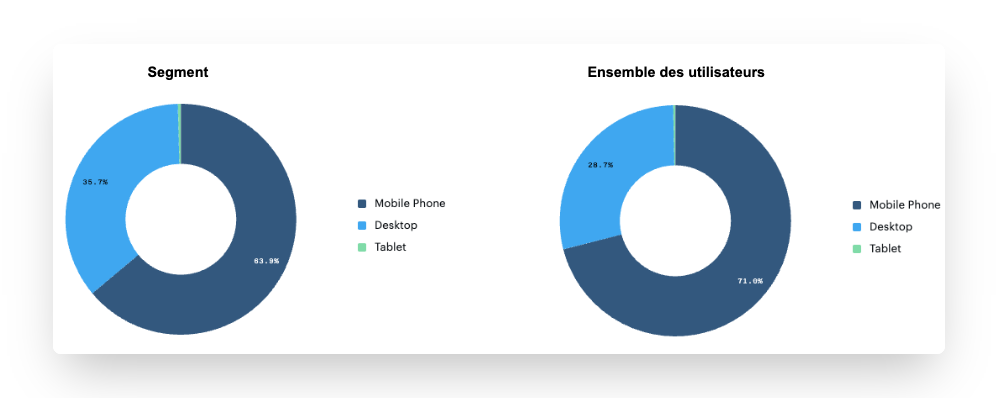
A first series of cross-references is carried out to identify any over-representations or anomalies, compared to the overall funnel population:
- Traffic source: a significant discrepancy can point to a poorly aligned promise upstream (e.g., over-representation of poorly qualified acquisition campaigns, or a particular channel).
- Technical environment: a concentration on certain browsers, OS, or devices can reveal display or compatibility issues on step 3.
- Business variables (custom): cross-referencing with data collected upstream (information declared in step 1) to detect a systematic mismatch between the user profile and the elements proposed in subsequent steps.
This segmentation work aims to identify recurring patterns within the exiting population. It then allows for formulating targeted hypotheses, which can be confirmed or refuted by observing the corresponding sessions in Clarity.
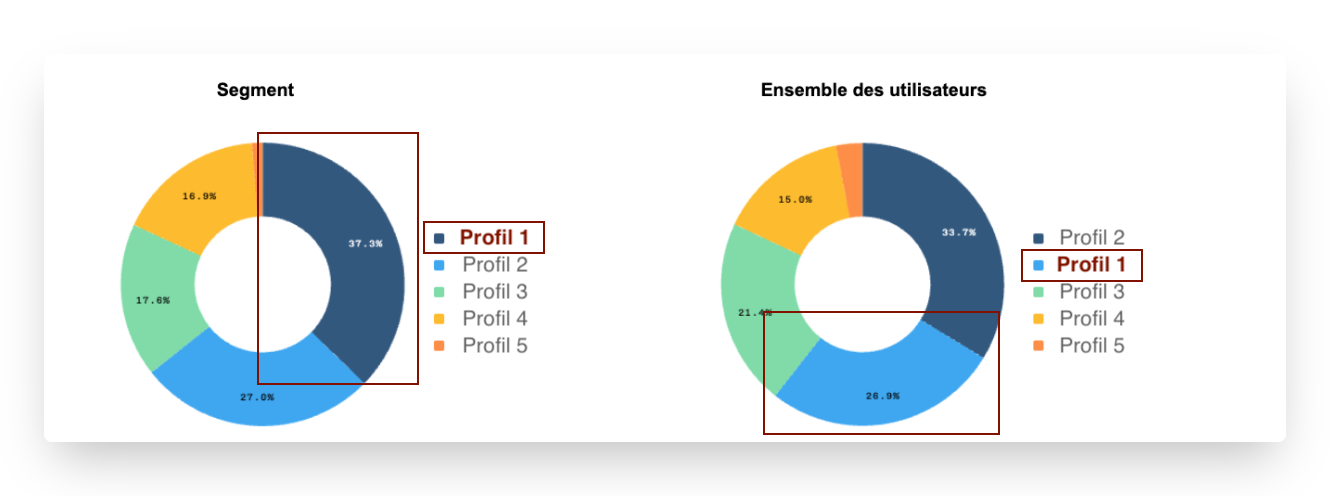
- Users of Profile 1 are over-represented in the segment where the drop is observed: 37.3% vs 26.9%, a difference of 10.4 points or +38%
- Hypothesis: Do users of Profile 1 not find an option corresponding to their need and have difficulty moving to step 3?
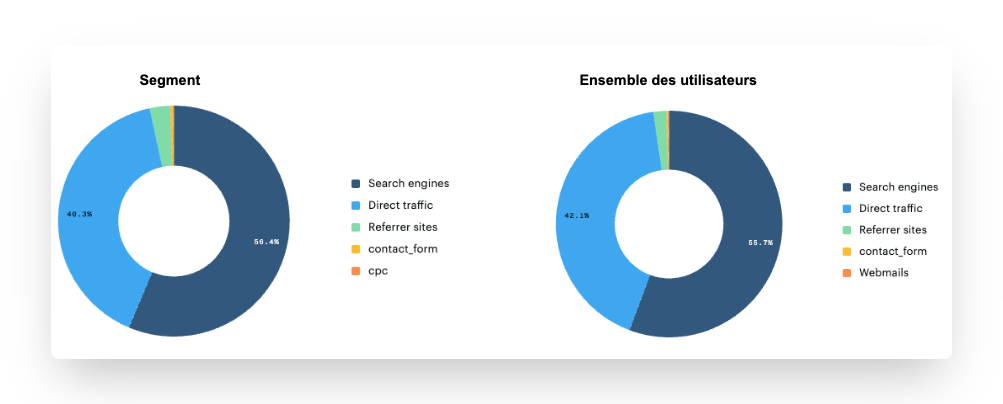
- No representative difference
- Desktop users seem more numerous in our segment: we identify a difference of 7.1 points, or a 10% difference
- Hypothesis: Do Desktop users encounter technical difficulties on the need selection step?
To go beyond quantitative reading, the hypotheses derived from the targeted segment must be confronted with real behavioral analysis. The objective here is to directly observe the sessions of exiting users, in order to confirm or refute certain probable causes of abandonment.
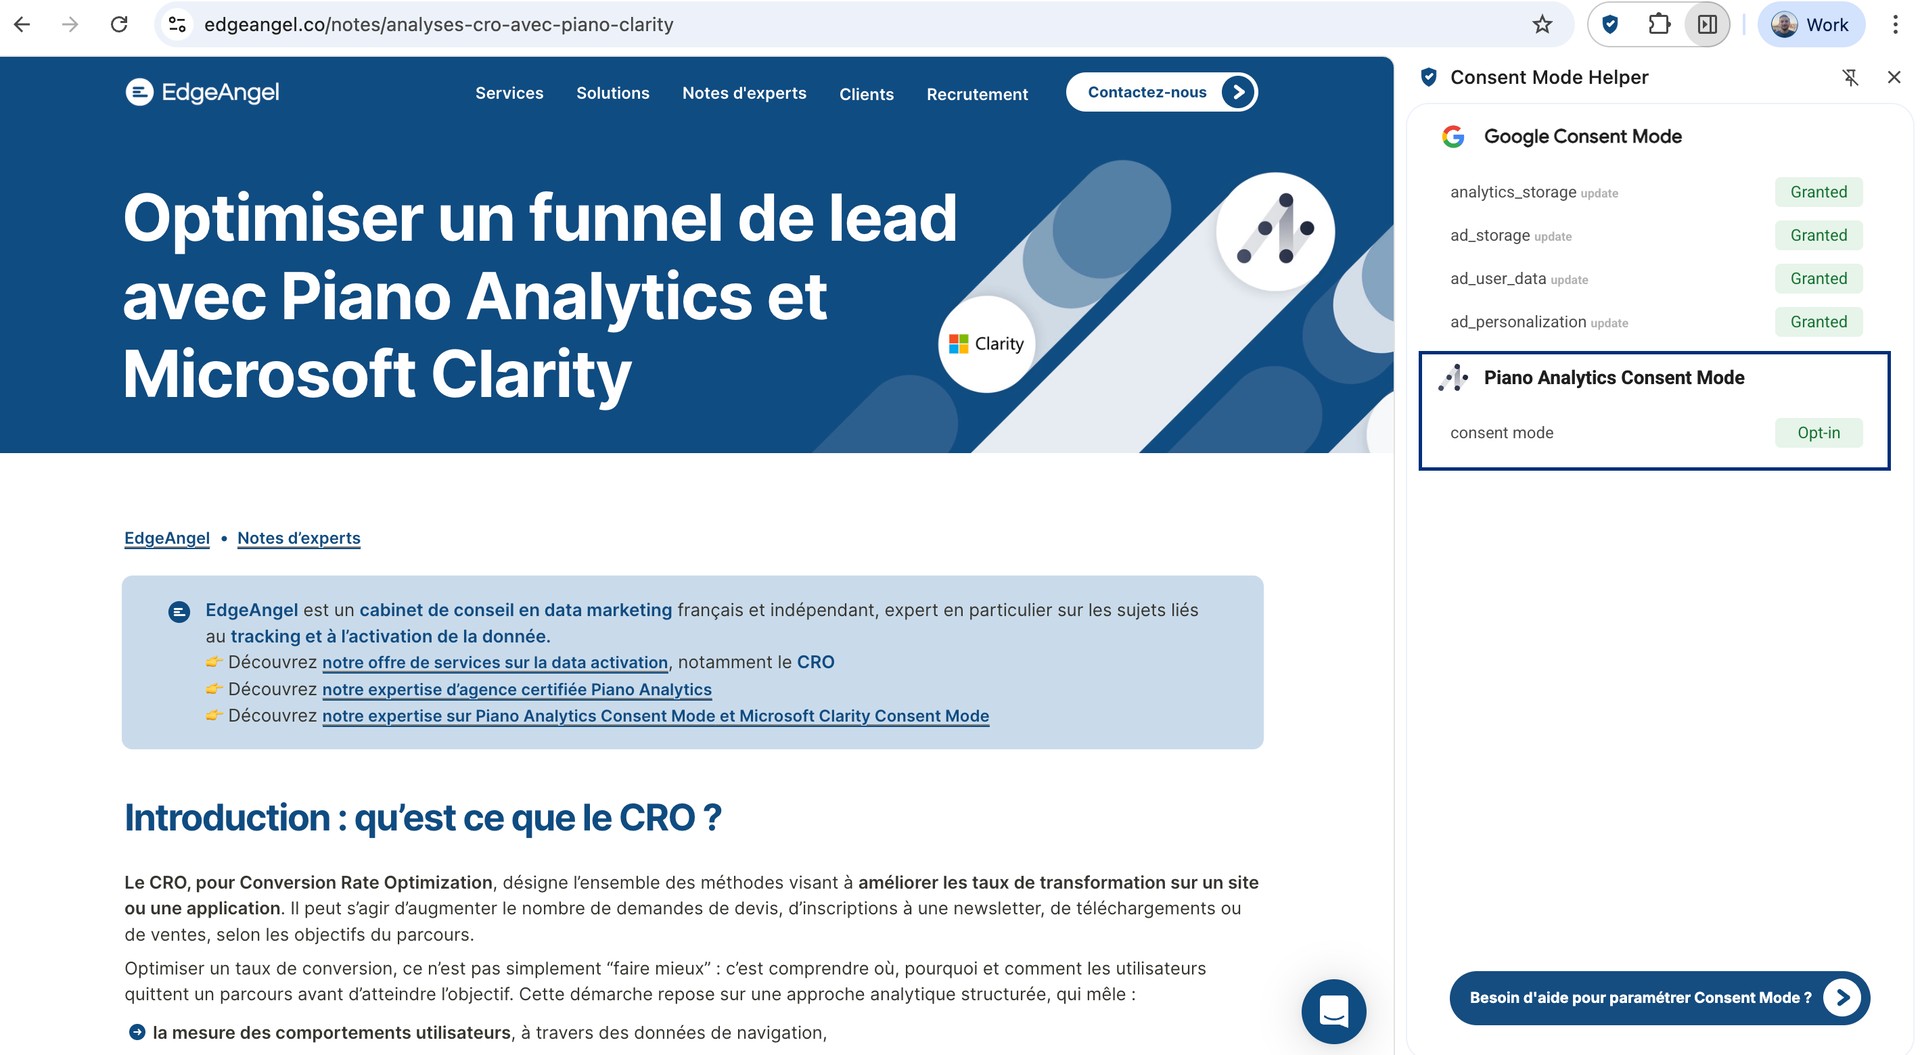
To do this, a bridge has been set up between Piano Analytics and Microsoft Clarity, via the user ID, and only for users who have given their consent.
"User ID" identifiers can only be collected with user consent. In particular, they cannot be collected under the exemption regime (cf. CNIL exemption guide for Piano Analytics). It is therefore necessary to ensure that the Clarity User ID is collected only in Opt-in consent mode on Piano Analytics.
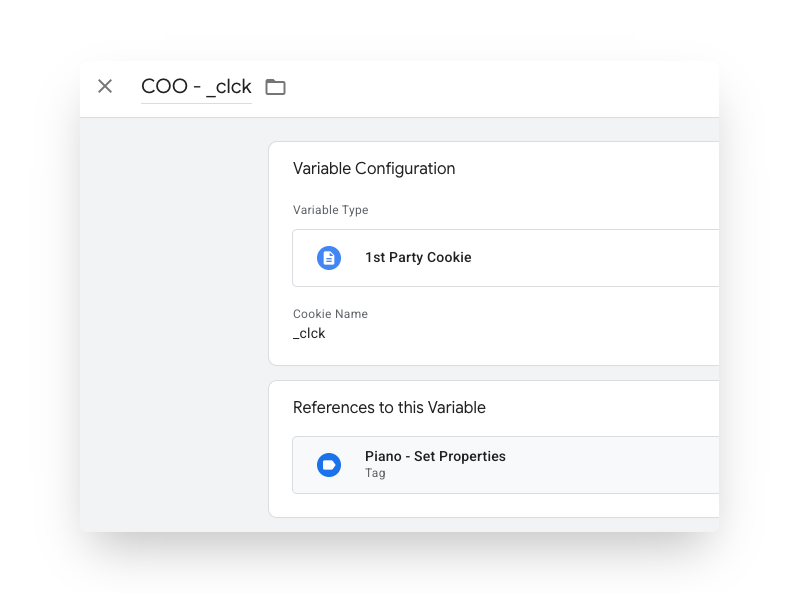
Technical implementation: specific configuration was carried
out in Google Tag Manager to retrieve the value of the Clarity User ID cookie (stored under the key _clck) deposited by Clarity
on the user's browser.
This value is then sent to Piano via a custom property clarity_user_id, integrated into setProperties.
Thanks to this setup, it becomes possible to directly retrieve the Clarity User IDs associated with a given segment in Piano, and then use them to filter session recordings in Clarity.
Given the significant loss observed in the segment of users who declared a Profile 1, it is proposed to prioritize this population. The Clarity User IDs associated with this segment are extracted from Piano, thanks to the configuration described above, to allow for targeted qualitative observation in Clarity.
Once the restricted list of Clarity User IDs is identified (ideally 10 to 30 users), these values are used to filter sessions in the Clarity interface.
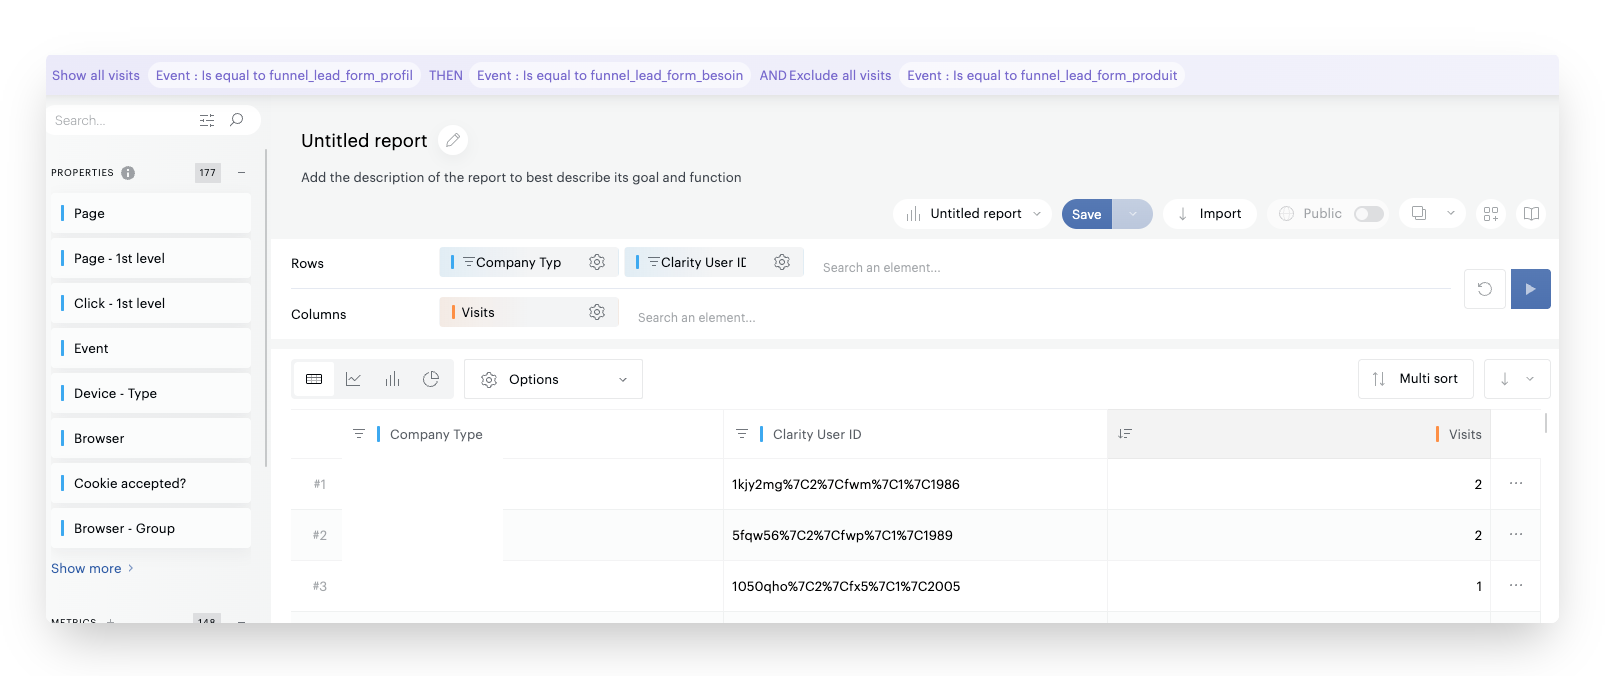
Note: The Clarity identifier reported in Piano is encoded with other
technical metadata, in the form of a string like
1050qho%7C2%7Cfx5%7C1%7C2005. Once decoded, it gives
1050qho|2|fx5|1|2005. Only the first 6 to 7 characters
correspond to the actual Clarity user ID used in the Clarity search
interface. This processing must be done before using the identifiers to
filter sessions.
A volume of 10 to 30 visits generally constitutes a good compromise: large enough to reveal recurring patterns, but restricted enough to allow for in-depth manual analysis. Beyond that, the risk is to multiply anecdotal observations or lose efficiency without significant gain in analytical robustness.
Qualitative Analysis on Microsoft Clarity: Behavioral Validation
The next phase consists of validating or invalidating the hypotheses made from Piano data, by observing the real behaviors of the users concerned via Microsoft Clarity. Here, we want to answer the hypothesis: "Users of Profile 1 do not find an option corresponding to their real need."
Targeting sessions to observe
Thanks to the upstream work, we just need to filter the sessions in the Clarity tool to analyze only the visits corresponding to our segment (via the Clarity User ID).
Hypothesis validation via behavior
The objective of this step is to confront the formulated hypotheses with the reality of interactions. Several recurring behaviors can thus be observed:
- Repeated back-and-forth movements between steps 1 and 2, suggesting a misunderstanding of the expected path or difficulty in matching the profile to the need,
- Multiple modifications of a parameter in step 1, indicating hesitation about the category to select, or a poorly understood classification,
- Abrupt stop after step 2 display, sometimes without clicking, which may suggest a display problem or a perceived inadequacy of the offer,
- High loading times, non-interactive elements, rage clicks, or rapid scrolls, all weak signals of technical or ergonomic friction.
Each session viewed in Clarity must be subject to a structured comment, allowing for an exploitable record of the observation. This step is essential for formalizing findings, facilitating cross-review, and feeding discussions with product or UX teams.
Here are the feedbacks on the first 4 analyzed sessions:
| Clarity User ID | Comment |
|---|---|
| 1050qho | Returns to previous step, then exits the funnel |
| 107naxa | Stays on the need step for 10 seconds then closes the window |
| 10c3gkx | Returns to previous step, selects another company type, then closes the window on the need step after a few seconds |
| 10n9e12 | Returns to previous step, selects another company type, then closes the window on the need step after a few seconds |
| etc. |
After a sample of 20 targeted sessions, several recurring behaviors were identified:
- More than half of the users returned to the previous step after step 2 was displayed.
- Among them, a majority modified their profile, suggesting doubt or dissatisfaction with the initially selected profile.
- In parallel, about 20% of users leave the funnel very quickly (less than 10 seconds after step 2 display).
- While approximately the same volume of users stay between 30 seconds and 1 minute, without further interaction.
These elements converge towards two main avenues:
- Perceived mismatch between the selected profile and the products displayed in the next step, prompting some users to go back to "test" another profile.
- Unmet expectation in step 2, possibly linked to a lack of immediate response to their need (e.g., specific product expected), generating rapid abandonment.
Recommended next steps
These findings can serve as a basis for targeted UX recommendations (e.g., clarification of profiles in step 1, immediate feedback in step 2, micro-indicators of continuity towards products), and/or for testing variations in the sequence of steps.
Structuring, Capitalizing, and Replicating the Approach
The value of this type of analysis relies as much on the relevance of the observations as on the ability to structure and capitalize on the lessons learned. It is essential to rigorously document:
- the hypotheses formulated at each step,
- the segments analyzed in Piano,
- the observations from Clarity viewing.
- the recommendations and actions resulting from the analysis
This structuring facilitates sharing between product, data, and UX teams, and allows moving from a one-off diagnosis to a replicable approach.
We recommend using a single template (e.g., Google Sheets or Notion) centralizing all the elements listed above.
This format facilitates the prioritization of projects to be tested, by highlighting frequent causes, weak signals, and isolated cases.
Conclusion: A Robust and Cross-Functional Approach
A Structured Approach and Directly Actionable Optimization Levers
This study illustrates the value of a cross-approach between analytical data and behavioral observation, applied to a multi-step quote request (lead) journey.
It allows going beyond a simple reading of conversion rates to understand, in a concrete way, where, how, and why users drop off.
By combining the functionalities of Piano Analytics (funnel, segments, custom properties) with Clarity recordings, we are able to:
- formulate tangible hypotheses,
- validate or reject them through observation,
- propose directly actionable optimization levers.
A Methodology Applicable to Other Cases
This approach can be transposed:
- to other analytics tools (e.g., Google Analytics),
- to other behavioral CRO analytics tools (e.g., Contentsquare, Hotjar, Mouseflow,…),
- and to many other journeys: forms, e-commerce funnels, simulators, or application onboarding.
As soon as a journey presents partial loss and available segmentation, this type of analysis offers a robust framework for identifying real pain points and prioritizing improvements.
More notes like this one?
We publish regularly on LinkedIn what we learn in the field. The algorithm doesn't favor us, so hit the bell to make sure nothing slips through.