Web Performance: Monitoring Core Web Vitals with CrUX API & a Modern Data Stack

Introduction
Web performance is often treated in "bursts": a technical audit (often alarming) conducted once a year, followed by an optimization sprint, then silence... until the next degradation.
However, loading speed is not just a technical checkbox to please the IT department. It is a living business metric.
Here is how we structured our approach to monitor this data continuously with a Modern Data Stack approach and the Chrome UX Report (CrUX) API.
1. Web Performance: The Foundation of Conversion and Brand Image
Web performance refers to the ability of your web setup to be fast. Speed is the first impression you give to your visitors. And it is key:
- Conversion & Revenue: The correlation is direct and brutal. Amazon calculated that one second of latency could cost them 1.6 billion dollars in annual sales [1]. At your scale, reducing load time mechanically increases conversion rates and average basket size.
- Brand Image & Trust: A slow or unstable site conveys a neglected brand image. In luxury or e-commerce, the fluidity of the experience is an essential vector of trust.
- SEO & GEO: Google penalizes slow sites. But beyond classic SEO ranking, working on web performance means working on a top-notch code architecture that prepares your content for answer engines (AI/LLM), which favor fast and structured sources (see our GEO approach).
2. Monitoring: Moving from "Tool" Logic to a Data Approach
To track these indicators, two philosophies are available to companies:
- The "SaaS Tool" approach: Quick to install, but creates a new data silo and a recurring license cost.
- The "Modern Data Stack" approach: This is our recommendation to guarantee the sovereignty of your data (see our dedicated page). The idea is to treat web perf as raw data, just like your sales.
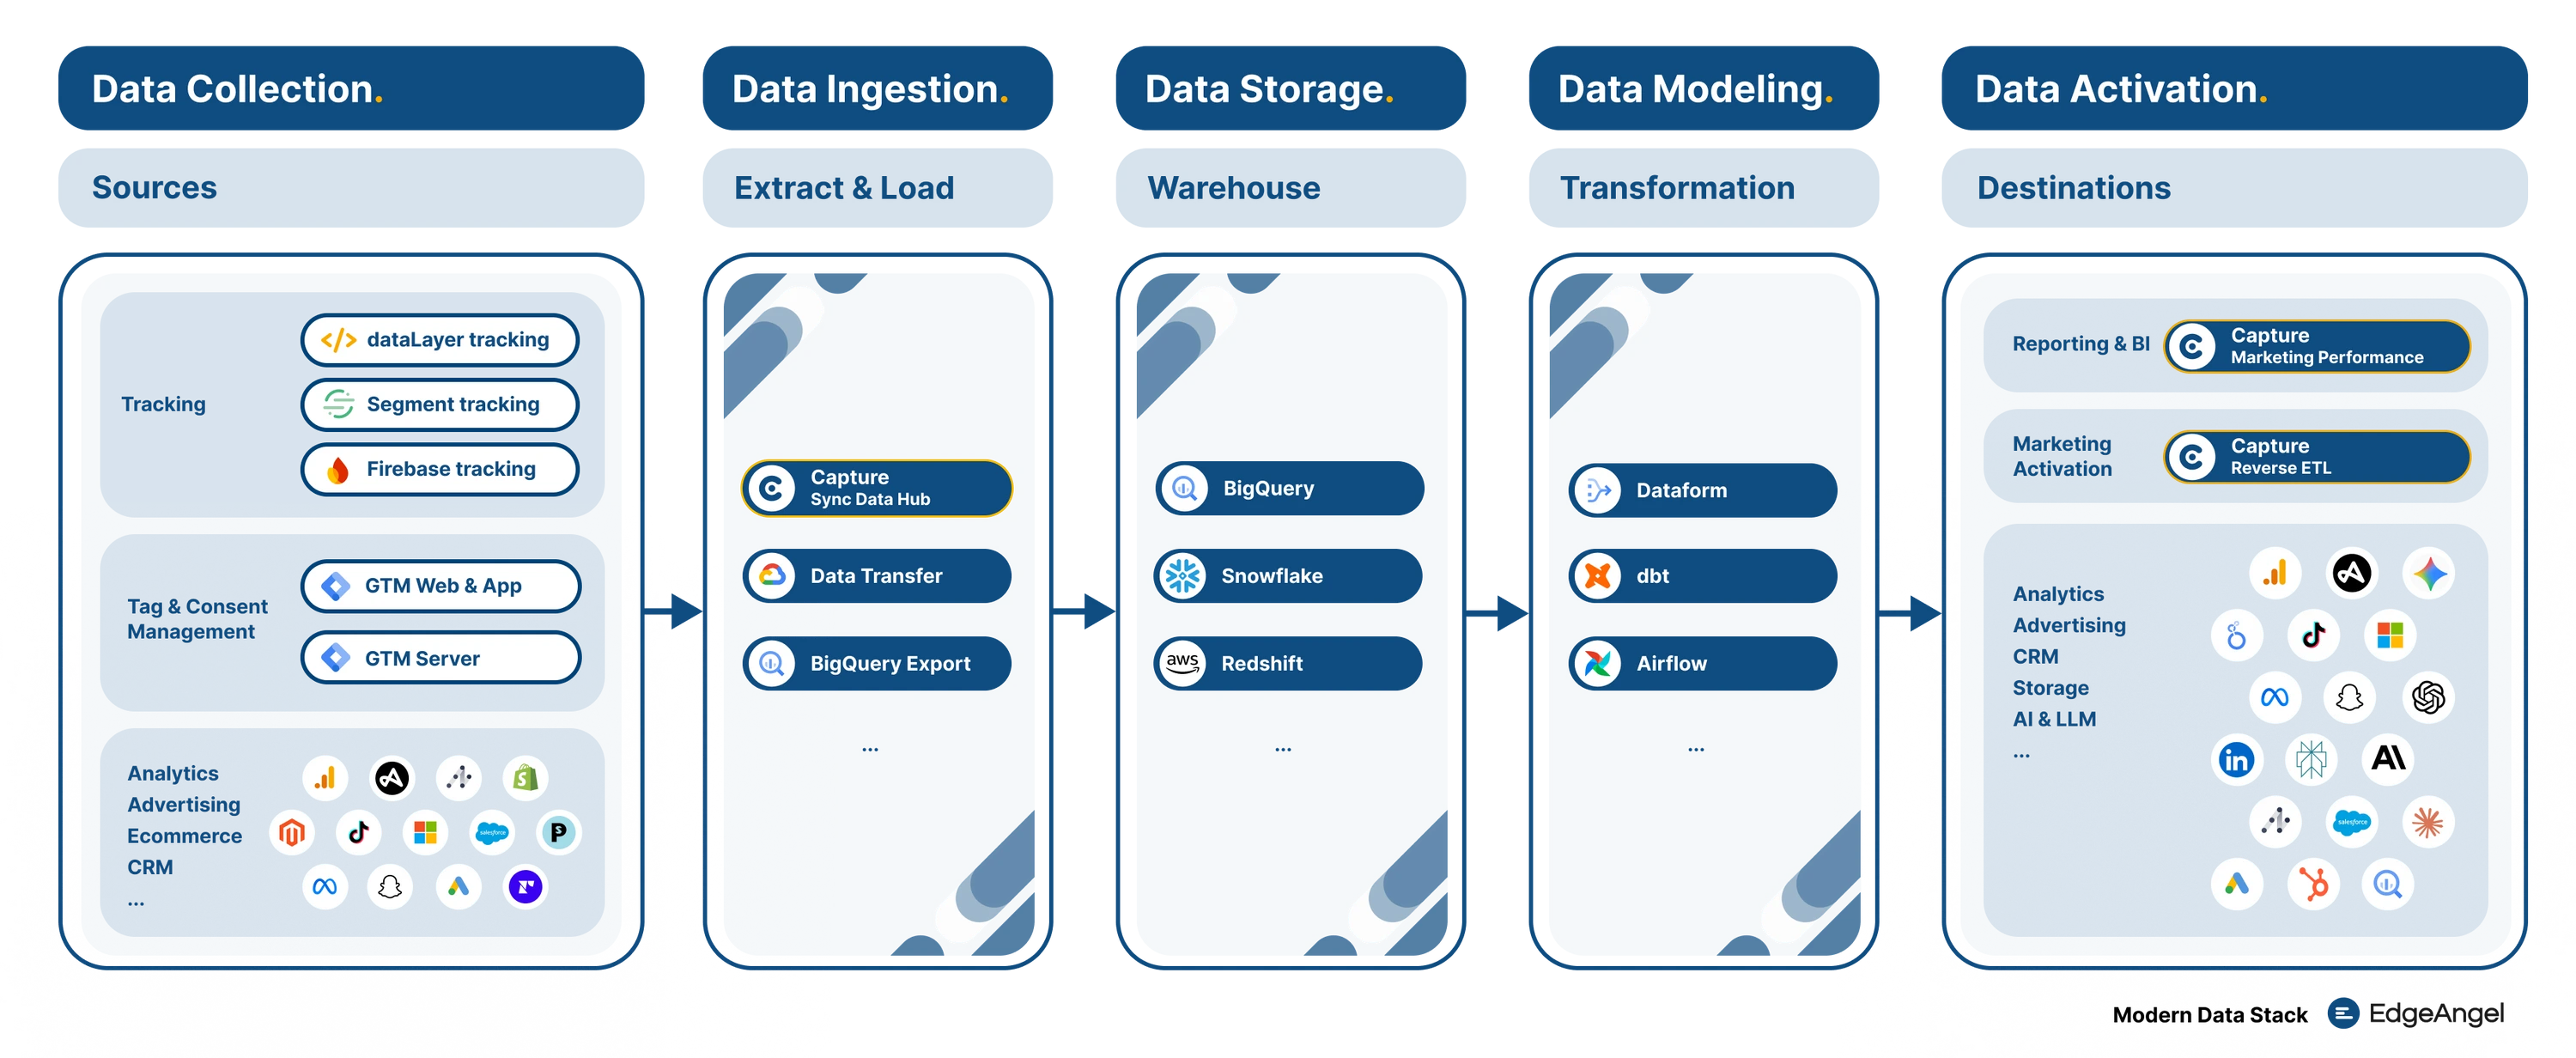
Data Flow: From raw collection to structured visualization
Instead of renting a visualization solution, you build your own pipeline: Ingestion > Storage (Warehousing) > Visualization. It is often more economical and, above all, allows you to cross-reference this data with the rest of your ecosystem.
3. Technical Architecture: Automated Pipeline with CrUX
To automate this tracking, here are the 3 key steps of the data pipeline:
1 Data Extraction via CrUX History API
Development of a custom Airbyte connector (a standard brick of the Modern Data Stack) to query the API. This approach allows retrieving up to 6 months of history.
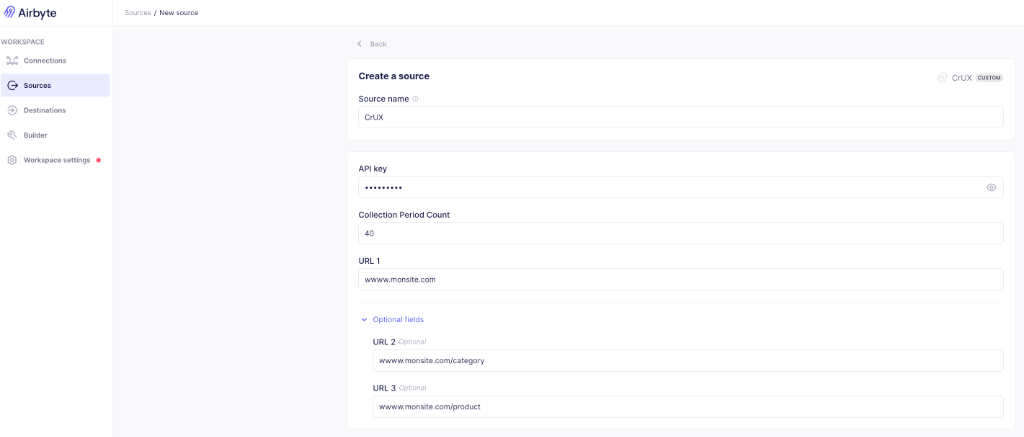
"Low-Code" Airbyte Connector configured for CrUX API
📚 Documentation: Airbyte Custom Connectors | CrUX History API
2 Storage and Transformation
Centralization of raw data in BigQuery. A transformation step (via Dataform or dbt) is necessary to clean the data and create a table optimized for visualization (flattening JSONs, calculating aggregates).
3 Visualization
Exposure of indicators in a BI tool like Data Studio or PowerBI. The dashboard is directly connected to the BigQuery table, guaranteeing data that is always up-to-date without manual intervention.

Demo Client - CWVDemo Client - Web Performance - Core Web Vitals
Home Page : https://www.demo-client.com/
Home Page : https://www.demo-client.com/
Interactive Demo: Explore Core Web Vitals metrics (LCP, INP, CLS) on mobile and desktop.
4. Expertise at the Service of Performance
Access to raw data changes how performance is managed. SEO and Web Performance consultants no longer navigate blindly:
- They correlate load times with real (not assumed) conversion rates.
- They identify precisely the pages or templates that penalize the global score (INP, CLS).
- They validate the technical impact of deployments (before/after) based on field data.
5. Going Further: Web Perf & Business
The strength of the Modern Data Stack lies in breaking down silos.
Once your performance data is secured in BigQuery, we can cross-reference it with your Analytics data (GA4, Piano) to answer precise financial questions:
- What is the lost revenue (in €/$) generated by pages that take more than 3 seconds to load?
- Is the bounce rate on mobile correlated with visual instability (CLS)?
Thus, we transform a technical constraint into a measurable growth lever.
🚀 Use Case: Prospecting & Monitoring (Agencies / SaaS)
A key point: CrUX data is public. This pipeline is not limited to your own site.
Automatically monitor the speed of competitor sites week after week.
For dev or SEO agencies, automatically detect prospects whose Core Web Vitals are deteriorating to propose a targeted high-value intervention.
Sources & References:
- Gigaspaces: Impact of Latency on Sales (Business Impact)
Need to activate this use case?
If you wish to monitor your Web Performance rigorously, don't hesitate. We would be delighted to discuss the implementation of your stack.
More notes like this one?
We publish regularly on LinkedIn what we learn in the field. The algorithm doesn't favor us, so hit the bell to make sure nothing slips through.